There comes a point when reading a P&ID where identifying the valve itself is no longer the hard part.
You recognize the valve. You know which direction the process flows. You can tell whether it has an actuator.
Then you notice circles labeled FT-101, FIC-101, PT-202, LSHH-301 and dashed lines running everywhere.
That’s when many beginners get lost.
Those circles aren’t clutter. They’re telling you what the plant is measuring, what decisions the control system is making, and what equipment responds to those decisions.
Once you understand the language of instrument tags and control loops, a P&ID starts behaving less like a drawing and more like a story.
Where We Are in the Series
So far we’ve built the foundation step by step:
Part 1 — Valve Symbol Fundamentals
Part 2 — Gate, Globe, Ball, Butterfly & Other Manual Valves
Part 3 — Check Valves & Flow Direction
Part 4 — Control Valves & Actuators
Part 5 — Relief, Safety & Special Valves
Now we’re going to connect those valves to the instruments controlling the process.
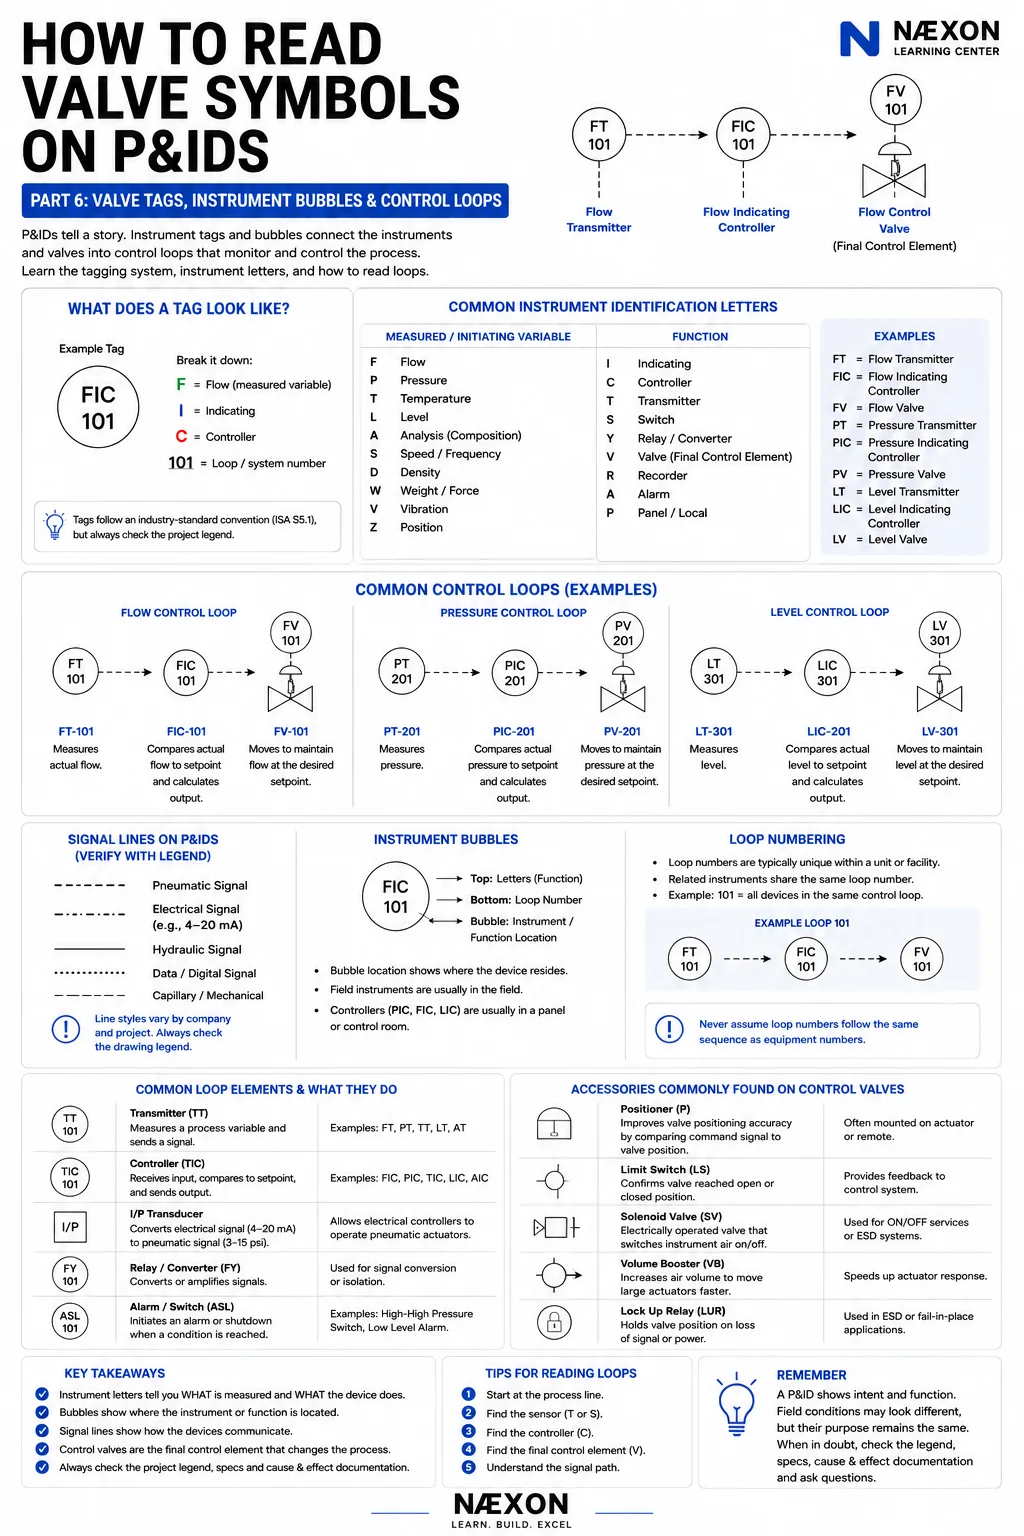
What Is an Instrument Tag?
Consider:
FIC-101
Don’t memorize that as one word.
Break it apart.
F — Flow
I — Indicating
C — Controller
101 — Loop identification number
So:
FIC-101 = Flow Indicating Controller associated with loop 101
That’s the basic method you’ll use throughout this chapter.
Read the letters from left to right and determine what each one is telling you.
The First Letter: What Are We Measuring?
Under commonly used instrumentation conventions, the first letter identifies the measured or initiating variable.
Some of the most common are:
F — Flow
P — Pressure
T — Temperature
L — Level
A — Analysis
There are many others.
But if you’re learning P&IDs, those four alone will let you understand a large number of everyday process loops.
For example:
FT
starts with F.
You’re dealing with flow.
PT
starts with P.
You’re dealing with pressure.
TT
starts with T.
You’re dealing with temperature.
LT
starts with L.
You’re dealing with level.
The Following Letters: What Does the Device Do?
After the first letter establishes the process variable, additional letters describe the instrument’s function.
Common examples include:
I — Indicating
C — Controller
T — Transmitter
S — Switch
A — Alarm
R — Recorder
V — Valve / final control element in common loop notation
These combinations create the tags you see across P&IDs.
Common Instrument Tags
Let’s put the pieces together.
FT — Flow Transmitter
Measures flow and transmits that information.
FI — Flow Indicator
Displays flow.
FIC — Flow Indicating Controller
Indicates flow and performs a control function.
FV — Flow Valve
The final control element associated with a flow loop under a common tagging convention.
PT — Pressure Transmitter
Measures pressure and transmits the measurement.
PI — Pressure Indicator
Displays pressure.
PIC — Pressure Indicating Controller
Indicates and controls pressure.
PV — Pressure Valve
A final control element associated with pressure control.
TT — Temperature Transmitter
Measures temperature and transmits the signal.
TI — Temperature Indicator
Displays temperature.
TIC — Temperature Indicating Controller
Indicates and controls temperature.
TV — Temperature Valve
A final control element associated with a temperature loop.
LT — Level Transmitter
Measures level.
LI — Level Indicator
Displays level.
LIC — Level Indicating Controller
Indicates and controls level.
LV — Level Valve
A final control element associated with level control.
The Loop Number
Now consider:
FT-101
FIC-101
FV-101
Notice anything?
They all contain:
101
That’s because they’re associated with the same control loop under the project’s numbering system.
Think of the number as the loop’s family name.
FT-101 measures the process variable.
FIC-101 controls it.
FV-101 changes the process.
The shared loop number helps you recognize that these devices belong together.
Loop Numbers Are Not Equipment Numbers
Don’t automatically assume loop numbering follows the same system as equipment numbering.
You might have:
P-101
and:
FT-101
That doesn’t necessarily mean the transmitter belongs specifically to Pump 101 just because both contain 101.
The project may use entirely separate numbering conventions.
Always understand the facility’s tagging system before drawing conclusions from matching numbers.
What Is an Instrument Bubble?
Instrument functions are commonly represented using circular symbols often called:
Instrument bubbles
or:
Instrument balloons
Inside the bubble you’ll see the tag.
For example:
FT 101
The letters tell you the instrument function.
The number identifies the loop according to the project convention.
But the appearance of the bubble can communicate additional information.
Bubble Lines Can Indicate Location
Depending on the drawing standard, different bubble configurations may indicate whether an instrument or function is:
Field mounted
Located on a main control panel
Located behind a panel
Accessible to the operator
Implemented in a control system
or otherwise located or represented.
For example, a simple circle may commonly indicate a field-mounted instrument, while lines through the circle can indicate panel or control-room location under certain conventions.
But this is exactly where memorization can cause problems.
Always check the project legend.
Symbol conventions can vary between companies and generations of drawings.
The Basic Flow-Control Loop
Let’s build a complete loop.
Suppose process fluid flows through a pipe and the plant needs to maintain:
500 gallons per minute.
The loop might appear conceptually as:
FT-101 → FIC-101 → FV-101
FT-101
Measures actual process flow.
Suppose it measures:
450 GPM
It transmits that information.
↓
FIC-101
Receives the measured flow.
The desired setpoint is:
500 GPM
The controller recognizes that actual flow is below the desired value.
It calculates an output.
↓
FV-101
Receives the control command.
The actuator changes valve position.
Flow increases.
↓
FT-101
Measures the new flow.
The cycle repeats continuously.
That is why it’s called a:
Control Loop
The measurement comes back around and influences the next control action.
Measure → Compare → Act → Measure Again
This pattern is one of the most useful concepts you can learn:
MEASURE
The transmitter determines what the process is actually doing.
↓
COMPARE
The controller compares the measured condition with the desired condition.
↓
ACT
The final control element changes the process.
↓
MEASURE AGAIN
The transmitter detects the result.
That basic idea applies to far more than flow.
Pressure Control Loop
Consider:
PT-201 → PIC-201 → PV-201
PT-201
Measures process pressure.
PIC-201
Compares actual pressure with the desired pressure.
PV-201
Changes position to influence pressure.
Same logic.
Different process variable.
Level Control Loop
Now imagine a vessel.
LT-301 → LIC-301 → LV-301
LT-301 measures the liquid level.
LIC-301 compares that level with its setpoint.
LV-301 adjusts a process flow to influence vessel level.
The control valve could be located on:
The inlet
or:
The outlet
depending on the process design.
That distinction matters.
Don’t assume every level-control valve works the same way.
Temperature Control Loop
Consider a heat exchanger.
The process needs to leave the exchanger at a certain temperature.
You might encounter:
TT-401 → TIC-401 → TV-401
TT-401 measures temperature.
TIC-401 evaluates the measurement.
TV-401 changes the flow of a heating or cooling medium.
For example, the valve might regulate:
Steam
Cooling water
Hot oil
Refrigerant
or another utility.
Again:
Measure → Compare → Act
Switches Are Different From Transmitters
This distinction is important.
A transmitter continuously communicates a measured variable over its designed range.
A switch typically changes state when a defined condition is reached.
Consider:
PSH-101
This may represent:
Pressure Switch High
When pressure reaches a specified high condition, the switch changes state.
You might also encounter:
PSL — Pressure Switch Low
LSH — Level Switch High
LSL — Level Switch Low
TSH — Temperature Switch High
depending on project conventions.
What Does HH Mean?
You may encounter tags such as:
LSHH
or:
PSHH
The additional letters can indicate more severe alarm or trip levels under a project’s convention.
For example:
LSH — Level Switch High
LSHH — Level Switch High-High
A high-high level condition might initiate something more serious than an ordinary high-level alarm.
It could potentially trigger:
Pump shutdown
Valve closure
Emergency action
or another protective response.
But the P&ID alone may not fully define that action.
For that, you may need the:
Cause-and-effect diagram
Logic diagram
Control narrative
or:
Safety instrumented system documentation
Alarm Tags
You may also see alarms represented within instrument identification.
For example:
PAH — Pressure Alarm High
PAL — Pressure Alarm Low
LAH — Level Alarm High
LAL — Level Alarm Low
TAH — Temperature Alarm High
The exact combinations depend on the project’s convention.
The important thing is learning to break the tag apart.
Take:
LAHH-301
Instead of memorizing it, read it:
L — Level
A — Alarm
HH — High-High
301 — Loop identification
Now the tag tells a story.
Signal Lines
The lines connecting instrument bubbles are just as important as the bubbles themselves.
Different line styles can represent different signal types.
Depending on the drawing legend, they may indicate:
Pneumatic
Electrical
Hydraulic
Data / digital
Capillary
Mechanical
or other connections.
This means you shouldn’t simply see:
FT-101 –––– FIC-101
and think:
“Those are connected.”
Ask:
How are they connected?
Is the signal pneumatic?
Electrical?
Digital?
That can tell you considerably more about the control system.
Why Older P&IDs Can Look Different
Industrial facilities can remain in service for decades.
A refinery may contain P&IDs originally drafted in:
1975
modified in:
1998
converted to CAD in:
2007
and revised again today.
Older instrumentation systems may have relied heavily on pneumatic control.
Modern systems may use:
DCS
PLC
digital communication
smart transmitters
and other technologies.
The P&ID symbology may reflect some of that history.
This is another reason the project legend is so important.
DCS — Distributed Control System
Many modern process plants use a:
DCS — Distributed Control System
The DCS receives process measurements, executes control functions, displays information to operators and sends commands to final control elements.
In our flow-control example:
FT-101
may transmit its measurement into the DCS.
The:
FIC-101
control function may exist inside the DCS rather than as a physical standalone controller mounted on a wall.
The DCS then sends an output toward:
FV-101.
So when you see a controller bubble on a P&ID, don’t automatically imagine a separate physical box.
The function may be implemented electronically within a larger control system.
PLC — Programmable Logic Controller
You may also encounter:
PLC — Programmable Logic Controller
PLCs are widely used for:
Equipment control
Sequences
Interlocks
Machine control
Shutdown functions
and many other industrial applications.
A P&ID may show signals entering or leaving a PLC-controlled system.
Again, the drawing shows the functional relationship.
Detailed programming logic normally lives elsewhere.
The Final Control Element
We’ve used this phrase several times.
A:
Final Control Element
is the device that physically changes the process in response to the controller’s output.
Often that’s a:
Control valve.
But it doesn’t have to be.
Other final control elements can include:
Variable-speed drives
Dampers
Heaters
Pumps
or other devices.
In this valve series, we’re primarily concerned with the valve.
So when you see:
FV-101
think:
This is where the control loop physically changes the process flow.
Valve Positioners in the Loop
Part 4 introduced the valve positioner.
Now let’s place it into the control-loop story.
Imagine:
FIC-101 → Positioner → FV-101
The controller requests a valve position.
The positioner helps move the actuator so the valve reaches the commanded position.
It can also use valve-position feedback to improve accuracy.
The positioner essentially helps translate the control command into actual valve movement.
I/P Transducers
Suppose the controller sends:
4–20 mA
but the pneumatic actuator system requires an air-pressure signal.
An:
I/P transducer
can convert:
Electrical current
into:
Pneumatic pressure
A simplified sequence might be:
FIC-101
↓
4–20 mA
↓
I/P
↓
Pneumatic signal
↓
Positioner
↓
Actuator
↓
FV-101
When you understand that chain, the small symbols surrounding a control valve suddenly make sense.
Solenoid Valves in Shutdown Loops
A solenoid valve may be used to control instrument air to an actuator.
For example:
Emergency shutdown signal
↓
Solenoid changes state
↓
Instrument air is vented
↓
Spring-return actuator moves
↓
ESDV closes
Now connect this with Part 5’s discussion of emergency shutdown valves.
The ESDV isn’t acting by magic.
There is a signal path and an energy path causing that valve to move.
That’s what you want to learn to see on the P&ID.
Control Loop vs. Safety Function
Not every instrument loop exists for routine process control.
Compare:
PT → PIC → PV
with:
PSHH → ESD system → ESDV
The first may continuously control pressure.
The second may act only when pressure reaches a dangerous high-high condition.
One manages normal operation.
The other protects against an abnormal condition.
Understanding the difference is essential.
Follow the Loop Backward
Here’s one of the best tricks for reading unfamiliar P&IDs.
Start at the control valve.
Suppose you find:
LV-305
Now follow its signal line backward.
What controls LV-305?
You find:
LIC-305
Now continue backward.
What provides the measurement?
LT-305
Now you know:
LT-305 → LIC-305 → LV-305
It’s a level-control loop.
You didn’t need to understand the entire drawing.
You simply followed the signal.
Follow the Loop Forward
You can also work in the opposite direction.
Suppose you find:
PT-402
Ask:
Where does its signal go?
It goes to:
PIC-402
Then:
Where does the controller output go?
It goes to:
PV-402
You just discovered a pressure-control loop.
This forward/backward tracing method works extremely well on complicated drawings.
A Complete Example
Imagine a vessel:
V-501
The P&ID shows:
LT-501 → LIC-501 → LV-501
and:
PT-502 → PIC-502 → PV-502
and:
LSHH-503 → ESD
Now read the process.
The vessel has a continuous level measurement and level-control loop.
It also has pressure measurement and pressure control.
Separately, a high-high level condition participates in a protective function.
Three different instrumentation functions.
One piece of equipment.
That’s how real P&IDs start becoming dense.
But once you separate the loops, they’re much easier to understand.
Instrument Loops Around Pumps
Suppose a pump has:
P-101
with:
PSL-101
on its suction.
That low-pressure switch might be associated with an alarm, trip or permissive depending on the system design.
You might also see:
PI-102
on the discharge.
That may simply provide pressure indication.
The presence of an instrument doesn’t automatically mean it controls something.
Ask:
Is this measurement?
Indication?
Alarm?
Control?
Trip?
The letters and signal connections help answer that.
Instruments Around Tanks
A storage tank might have:
LI — Level Indicator
LAH — Level Alarm High
LAL — Level Alarm Low
LSHH — Level Switch High-High
LT — Level Transmitter
Each serves a different purpose.
The transmitter may provide continuous level measurement.
The indicator displays the measurement.
The alarms alert operators.
The high-high switch may participate in a protective action.
Same process variable.
Different functions.
Don’t Assume the P&ID Shows Every Detail
The P&ID shows the functional relationship between instruments and equipment.
But detailed information may live in:
Instrument index
Instrument data sheets
Loop diagrams
Wiring diagrams
Cause-and-effect diagrams
Logic diagrams
Control narratives
I/O lists
Cable schedules
Vendor drawings
A P&ID tells you:
What interacts with what.
A loop diagram may tell you exactly:
How the devices are wired or connected.
Understanding the difference prevents you from expecting one drawing to contain everything.
How to Read Any Control Loop
Use this method:
1. Find the process variable.
Flow?
Pressure?
Temperature?
Level?
2. Find the measuring device.
FT?
PT?
TT?
LT?
3. Follow the signal.
Where does the measurement go?
4. Find the controller.
FIC?
PIC?
TIC?
LIC?
5. Follow the controller output.
Where does the command go?
6. Find the final control element.
FV?
PV?
TV?
LV?
7. Look for accessories.
I/P?
Positioner?
Solenoid?
Limit switch?
8. Look for alarms and switches.
High?
Low?
High-high?
Low-low?
9. Check the loop number.
Which instruments belong together?
10. Check the project legend.
Always verify project-specific symbology and abbreviations.
Don’t Memorize Tags — Decode Them
This is the central lesson from Part 6.
When you encounter:
PIC-204
don’t memorize PIC-204.
Decode it.
P = Pressure
I = Indicating
C = Controller
204 = Loop identification
When you encounter:
LSHH-307
decode it.
L = Level
S = Switch
HH = High-High
307 = Loop identification
Once you learn the language, unfamiliar tags become readable.
Series Progress
We now have:
Part 1 — Valve Symbol Fundamentals
Part 2 — Gate, Globe, Ball, Butterfly & Other Manual Valves
Part 3 — Check Valves & Flow Direction
Part 4 — Control Valves & Actuators
Part 5 — Relief, Safety & Special Valves
Part 6 — Valve Tags, Instrument Bubbles & Control Loops
We’re almost ready to put everything together.
But first, we need to address one of the most commonly misunderstood areas of valve symbology:
Normal position versus failure position.
Coming Next
How to Read Valve Symbols on P&IDs — Part 7: Normally Open, Normally Closed & Fail Positions
Part 7 will break down:
NO — Normally Open
NC — Normally Closed
FO — Fail Open
FC — Fail Closed
FL — Fail Last / Fail Locked
and the critical difference between where a valve normally operates and where it goes when its operating energy disappears.
We’ll also work through real process examples involving fuel gas, cooling water, steam, emergency shutdown valves and bypass arrangements so you can understand why engineers intentionally choose different failure positions.
Because when you’re reading a P&ID, knowing that a valve closes isn’t enough.
You need to know: