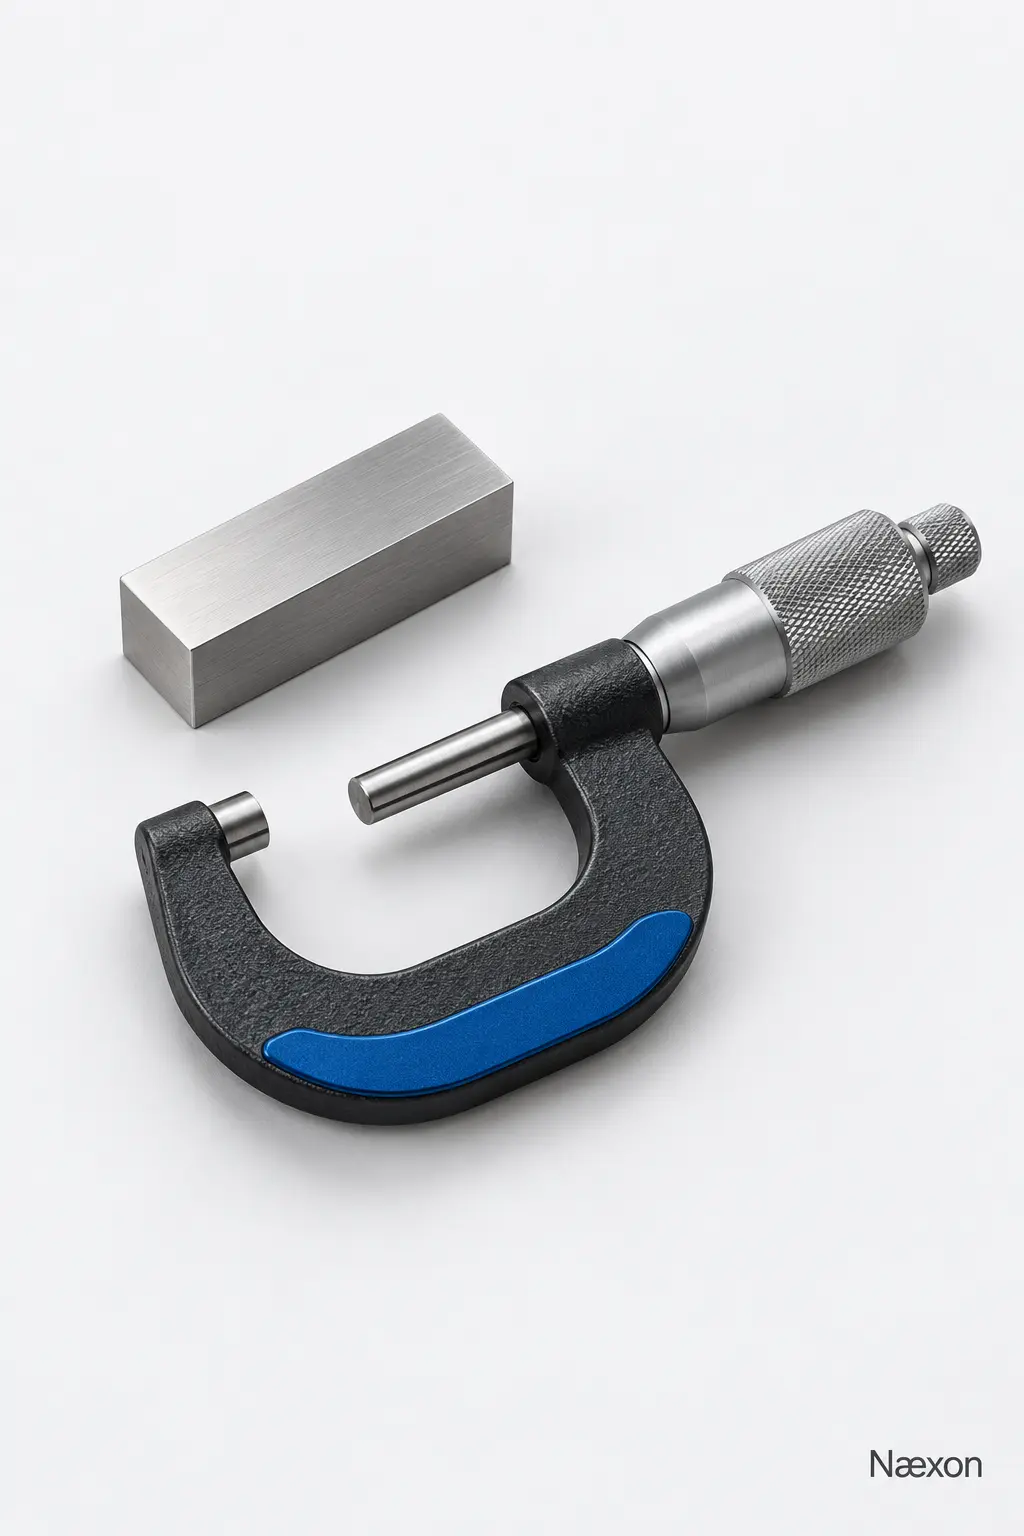
Morning Edition · QC inspectors · Apprentice · Fundamentals · 8-minute read
What you will learn: Calculate the spread and average of repeated readings, compare that average with a reference value, and explain why a repeatable result is not automatically accurate.
Five measurements come back almost identical. The inspector feels confident—until the same instrument checks a reference and reads consistently high. Nothing is jumping around, but something still needs investigation. Agreement between readings answers a different question from agreement with a reference.
The guide to calipers, micrometers, and dial indicators explains tool selection and contact technique. This lesson takes the next step: interpreting a small set of numbers without confusing spread, reference error, and acceptance. It is a paper-based introduction, not a calibration procedure or a substitute for a measurement-system study.
Separate the two questions
Repeatability concerns agreement when the same quantity is measured repeatedly under the same conditions over a short period. Keep the method, operator, instrument, location, and relevant environmental conditions consistent. Releasing and re-establishing the specified contact tests the setup more meaningfully than simply copying an unchanged display five times.
Accuracy concerns agreement with the quantity being measured. In practice, a suitable reference provides a comparison value with its own stated uncertainty and conditions. A tightly grouped set of readings can sit above or below that reference. Repeating the same measurement does not automatically remove a systematic influence.
The quantity being measured is sometimes called the measurand. Define it precisely: the distance between two identified faces is different from a diameter at an unspecified location. If you move along a tapered shaft, changing readings may describe the part rather than poor repeatability. Do not mix different features into one repeatability calculation.
What display digits do not prove
A digital display changing in 0.001 mm steps has a finer displayed increment than one changing in 0.01 mm steps. That does not, by itself, establish smaller measurement error. Resolution, instrument performance, reference quality, setup, and environment are different considerations.
Likewise, five identical readings do not prove zero uncertainty. Changes smaller than the displayed increment can remain invisible. A common setup error can affect all readings in the same direction. The inspection plan determines whether the instrument and method are suitable for the required decision; the number of decimal places does not decide that for you.
Worked example: a narrow spread with an offset
Assume a training reference has an assigned value of 25.000 mm under the stated comparison conditions. Its value is treated as fixed for this arithmetic exercise only; real reference uncertainty must be considered in actual inspection. Five independent reseatings using the same method produce 25.011, 25.012, 25.013, 25.012, and 25.012 mm. These are invented teaching data, not a specification for any instrument.
Let x represent a reading in millimeters and n the number of readings. The sample range, R, is the largest reading minus the smallest:
R = 25.013 mm − 25.011 mm = 0.002 mm.
The arithmetic mean, written here as x̄, is the sum divided by the count. The five readings total 125.060 mm, so x̄ = 125.060 mm ÷ 5 = 25.012 mm. The count is dimensionless; the mean retains millimeters.
Now calculate the signed difference between the mean and the assigned reference, d = x̄ − xref. Here d = 25.012 mm − 25.000 mm = +0.012 mm. The positive sign means the mean indication is above the assigned reference. This estimates an offset for this particular comparison; it does not establish a correction across the whole instrument range.
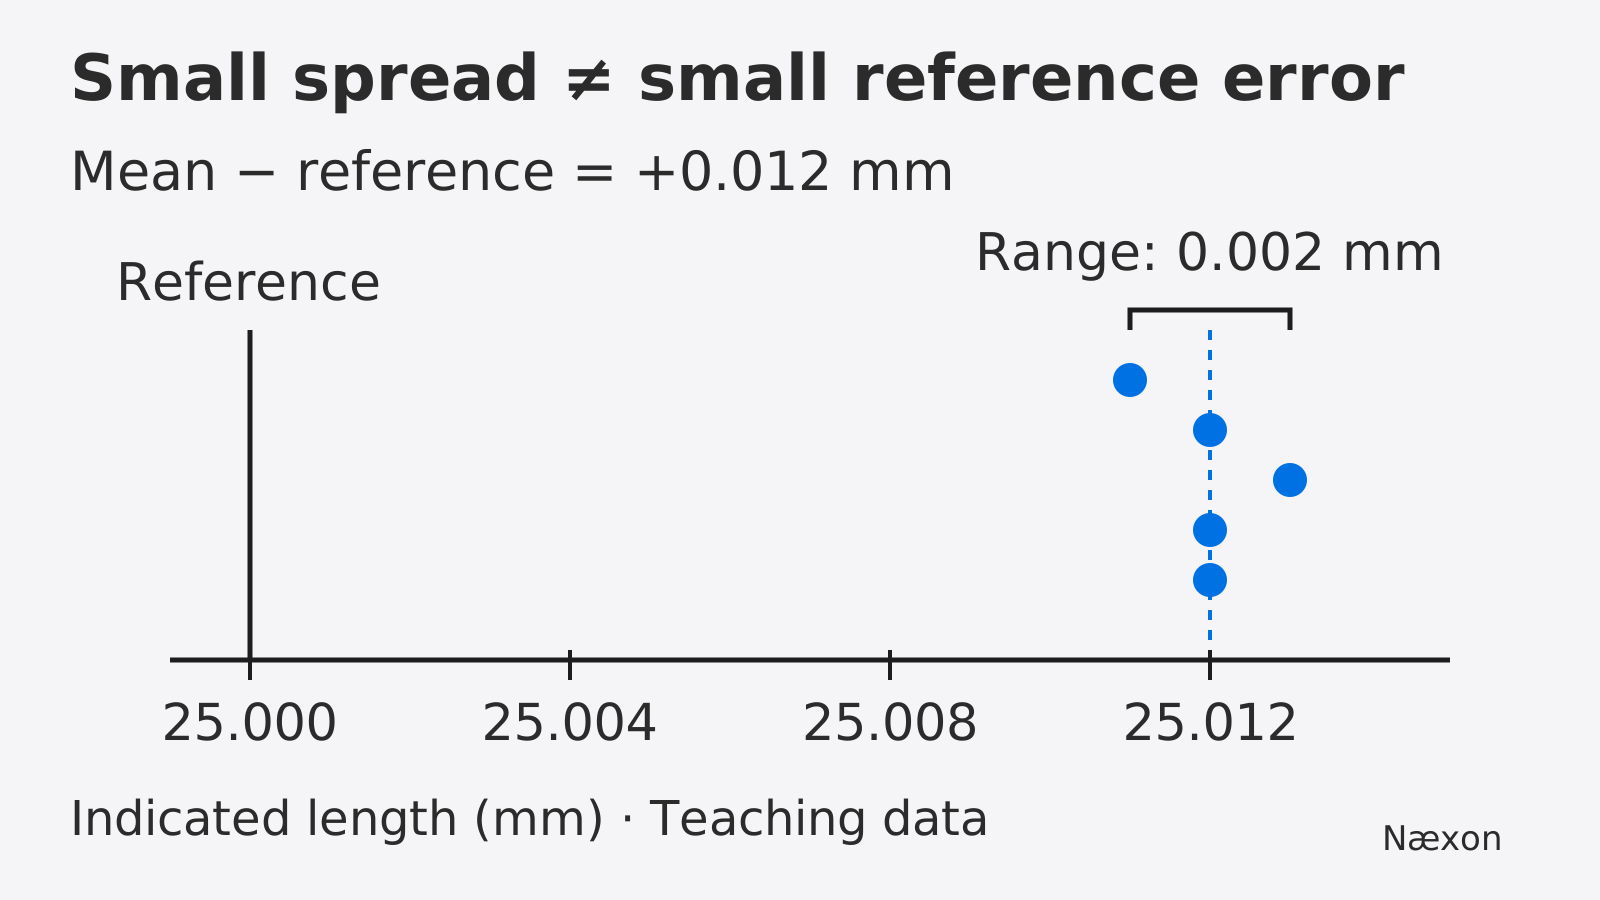
Check the mean independently by subtracting the reference first. The five differences are +0.011, +0.012, +0.013, +0.012, and +0.012 mm. Their sum is +0.060 mm; dividing by five gives +0.012 mm, matching the direct calculation. The two outer readings balance around 25.012 mm, with the other three exactly at that value.
For scale, 1 mm equals 1,000 micrometers, so 0.002 mm is 2 micrometers and 0.012 mm is 12 micrometers. The offset is six times the observed range. This is a useful reasonableness check, not a pass/fail rule. No rounding was needed; keep the original readings and use the approved reporting convention on actual work.
Why this is not a calibration certificate
A range is an easy first description of a small data set, not a complete estimate of measurement uncertainty. Five readings at one reference size do not establish performance at other sizes, on another day, or with another operator. Formal studies use planned repetitions and statistical measures, commonly standard deviations, to characterize variation more reliably.
The incorrect conclusion is, “The range is only 0.002 mm, so the tool is accurate to 0.002 mm.” The correct conclusion reports both observations: a 0.002 mm range in this series and a +0.012 mm difference between its mean and the assigned reference. Neither observation supplies the governing acceptance limit.
Do not silently subtract 0.012 mm from every production result. A correction needs a justified scope and an approved method. The discrepancy might involve the reference, temperature, contamination, contact, units, or the instrument. A number can describe the problem before its cause is known.
A practical checking sequence
First identify the instrument, feature, units, reference, and approved inspection method. Check calibration status and reference documentation. Use an authorized, stable training setup; never introduce handheld measuring tools into powered rotating equipment.
Next inspect measuring contacts and follow the manufacturer's cleaning and handling instructions. Allow the instrument, reference, and workpiece to reach the required temperature condition. Use the specified measuring-force device and contact orientation rather than squeezing harder to obtain the expected value.
Then record each reading in order while re-establishing the same measurement setup. Record abnormal observations instead of deleting inconvenient results. Calculate the mean and range, compare with the reference where applicable, and refer any discrepancy to the responsible inspector or metrology function under the approved procedure.
Finish by preserving traceability: instrument and reference identities, measured feature, operator, units, relevant conditions, readings, calculations, and the decision or escalation. Another person should be able to distinguish an observed value from an assumption.
When the pattern points to a problem
If readings scatter after reseating, inspect contact consistency, cleanliness, alignment, support, and measuring force. These are candidate causes, not a diagnosis from the range alone. If readings drift steadily with time, investigate changing temperature or setup conditions rather than averaging the trend away.
If readings cluster but disagree with the reference, confirm the reference identity, assigned value, unit system, and comparison conditions. An apparently good zero check cannot establish performance everywhere in the range. Escalate unresolved disagreement; do not adjust the instrument without authorization.
If two operators disagree, compare their methods and contact locations. Their combined readings are not a same-operator repeatability series. Describe what changed before combining results. The same discipline matters when interpreting bridge cam gauge measurements: a repeated reading on the wrong datum remains a poor basis for disposition.
Common mistakes and Field Rules
Common mistakes include rounding before calculating, mixing inches with millimeters, averaging different locations, recording only the best-looking result, and treating a calibration sticker as proof that today's setup is correct. A stable display is evidence about the indication, not proof that every relevant condition is controlled.
- Define the same feature before repeating a measurement.
- Report observed spread separately from reference disagreement.
- Keep units and the sign of the difference visible.
- Use the approved decision rule; never invent a universal acceptable range.
Knowledge Check
- Three readings are 10.008, 10.009, and 10.010 mm against a 10.000 mm training reference. What are their mean, range, and mean-reference difference?
- Five readings are identical. Does that establish zero uncertainty?
- You measure five different points along a shaft and calculate their range. What prevents calling this instrument repeatability?
- A narrow cluster lies above the reference. Should you automatically subtract that offset from every future reading?
Answers and explanations
1. The mean is 10.009 mm, the range is 0.002 mm, and the mean-reference difference is +0.009 mm. The small spread does not erase the offset. 2. No: display resolution and shared systematic influences can conceal variation or disagreement. 3. Different points may have different actual dimensions; the measurand was not held constant. 4. No: investigate the comparison and obtain an approved correction method, if appropriate, with a defined scope.
Practical Exercise
On paper, compare two illustrative series against a 20.000 mm assigned reference. Series A is 20.006, 20.007, 20.008 mm. Series B is 19.996, 20.000, 20.004 mm. Calculate each mean, range, and mean-reference difference without deciding whether either instrument passes inspection.
Expected results: A has mean 20.007 mm, range 0.002 mm, and difference +0.007 mm. B has mean 20.000 mm, range 0.008 mm, and difference 0.000 mm. A groups more tightly; B's mean agrees with the reference but its individual readings spread farther apart. Check by summing deviations around each mean: they should cancel. Neither short series proves the method suitable for production.
For another example of separating an indication from what it proves, continue with how a pressure gauge turns pressure into a reading. Næxon’s measurement lessons share one principle: understand the measurement chain before trusting its final number.